 |
|
 |
| STATISTICS |
| CSSA Scheme |
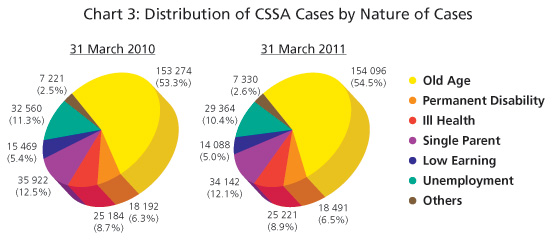
| 3.9 |
As at 31 March 2010, there were 287 822 CSSA cases providing assistance to 479 167 people. The number of CSSA cases and recipients were 282 732 and 462 564 respectively as at 31 March 2011. The number of low earnings, unemployment and single parent cases decreases in the past two years whereas slight increases were noted in the number of old age, permanent disability and ill health cases registered during the same period. Analysis of distribution of CSSA cases by nature of cases as at 31 March 2010 and 31 March 2011 respectively is shown in Chart 3 below: |
|
| |
 |
| |
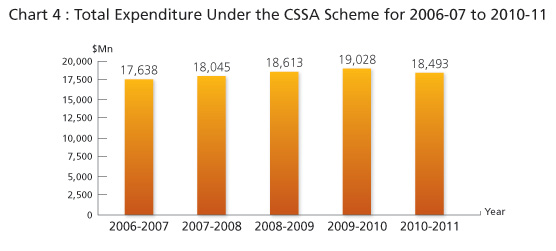
| 3.10 |
A total of $18,493 million was paid out under the CSSA Scheme in 2010-11. The total expenditure for the years 2006-07 to 2010-11 is shown in Chart 4 below: |
|
| |
 |
| |
| SSA Scheme |
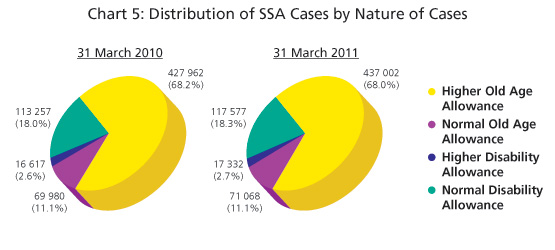
| 3.11 |
As at 31 March 2010 and 2011, the numbers of SSA cases were 627 816 and 642 979 respectively. A breakdown of these cases by nature of cases is shown in Chart 5 below: |
|
|
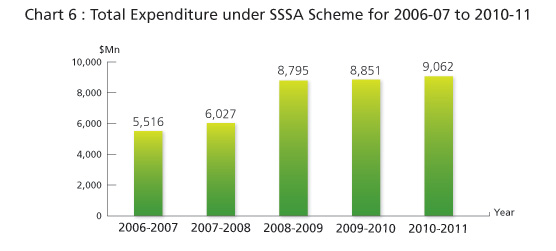
| 3.12 |
A total of $9,062 million was paid out under the SSA Scheme in 2010-11. The total expenditure for the years 2006-07 to 2010-11 is shown in Chart 6 below: |
|
| |
 |
|
|
| |
|
| |
| |
|
|
|